

GBP/USD Slides to 5-Week Low, But Faces Resistance Ahead
Current Price Action: GBP/USD has extended its decline, reaching a new 5-week low at 1.2660 during early trading. However, the pair experienced a partial recovery later, climbing to 1.2744 by the afternoon, reflecting a 0.43% gain. This movement was largely driven by U.S. jobless claims data that came in softer than expected, reducing the likelihood of aggressive rate cuts by the Federal Reserve. As a result, the pair managed to hold near its daily high.
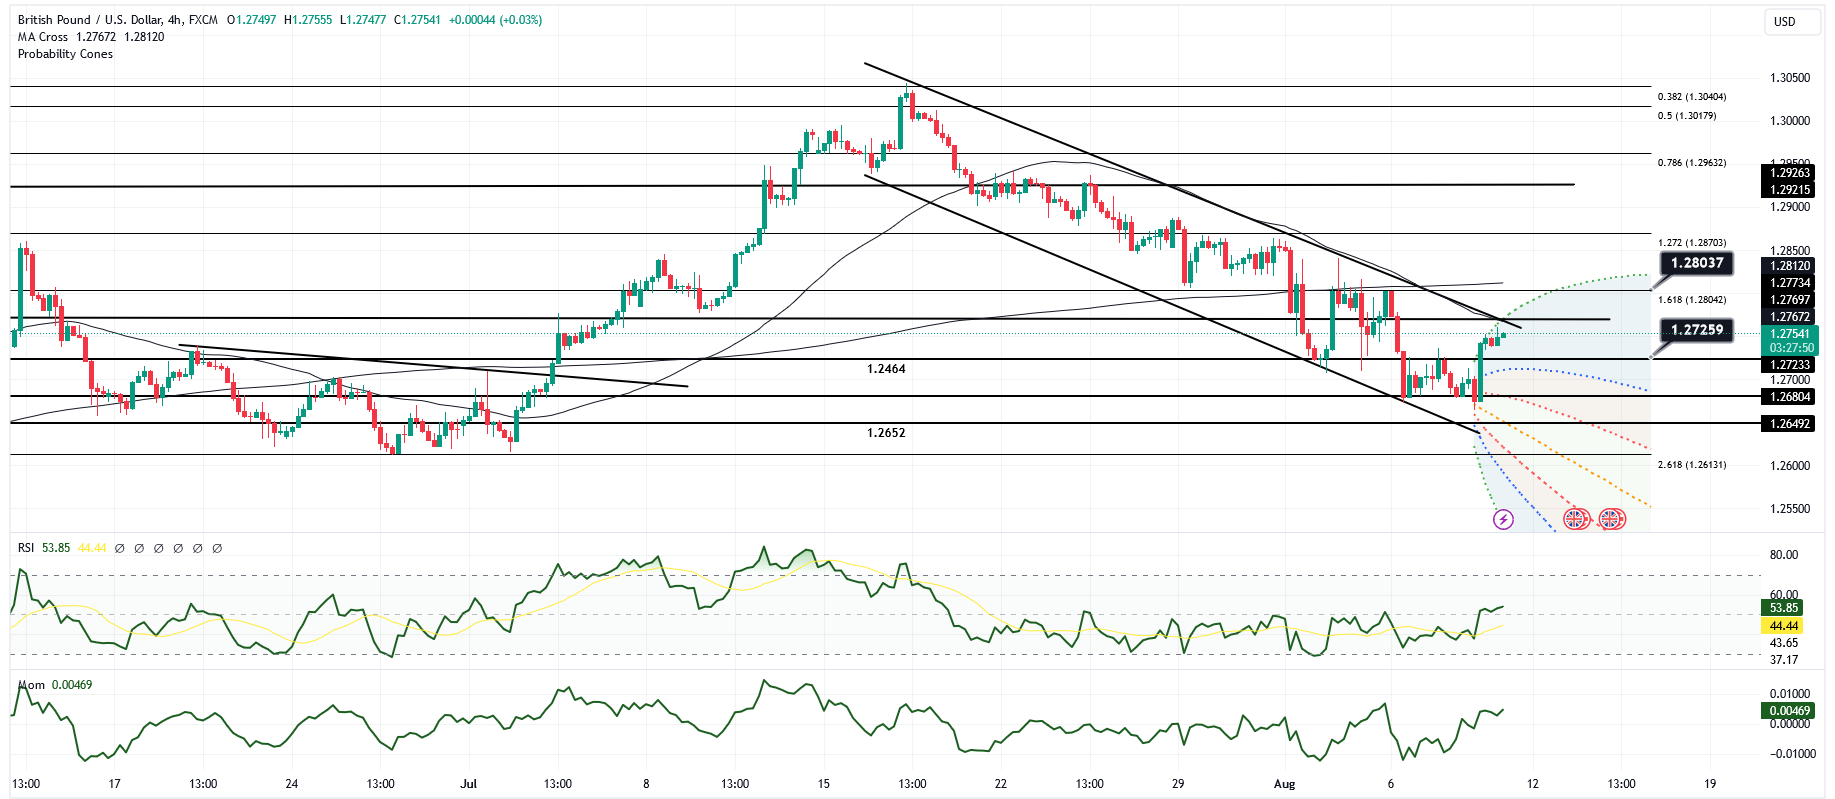
Key Technical Levels:
Support Levels:
- 200-Day Moving Average (DMA): 1.2650
- Base of the Daily Cloud: 1.2620
- 30-Day Moving Average (HMA): 1.2685
Resistance Levels:
- Falling 20-DMA: 1.2775
- 50% Fibonacci Retracement of 1.3040-1.2620: 1.2840
- 20-DMA: 1.2895
Technical Indicators:
The pair's third consecutive dip below the 100-DMA at 1.2680 reinforces a bearish outlook for GBP/USD. Additionally, the 10-DMA crossing below longer-term moving averages signals a growing bearish momentum. Although the pair remains above the daily cloud (1.2710-1.2640), failure to maintain this level could lead to further declines towards the lows seen in early May around 1.2500 and 1.2400.
Fundamental Analysis:
Market Sentiment and Influences: The recent U.S. jobless claims report, which came in weaker than expected, has tempered expectations for aggressive rate cuts from the Federal Reserve. This has provided some support to GBP/USD, helping it recover from its earlier lows. However, the broader outlook remains bearish, influenced by the dovish shift in Fed rate expectations and the Bank of England's recent 25 basis point rate cut, leading to an exit of GBP net speculative longs.
Interest Rate Expectations: Despite expectations for a higher rate trajectory in the UK compared to the U.S. for 2024 and 2025, the recent dovish Fed outlook and the BoE's rate cut have weighed on GBP/USD. Market participants are now focused on upcoming inflation and growth data from both the U.S. and the UK to gauge the pair's future direction.
Overall Outlook: The technical setup for GBP/USD indicates increasing bearish momentum, particularly with the pair's repeated failures to hold above key support levels like the 100-DMA. A drop below the daily cloud base at 1.2640 could pave the way for further declines towards the early May lows near 1.2500 and 1.2420. On the flip side, if the pair breaks above the 20-DMA resistance at 1.2775, it could test higher resistance levels. However, the bearish cross of the 30-DMA through longer-term moving averages suggests that any upside potential may be limited.