

Cable's Bull Run Loses Steam Below 1.33; Technical Indicators Signal Near-Term Correction
Technical Analysis:
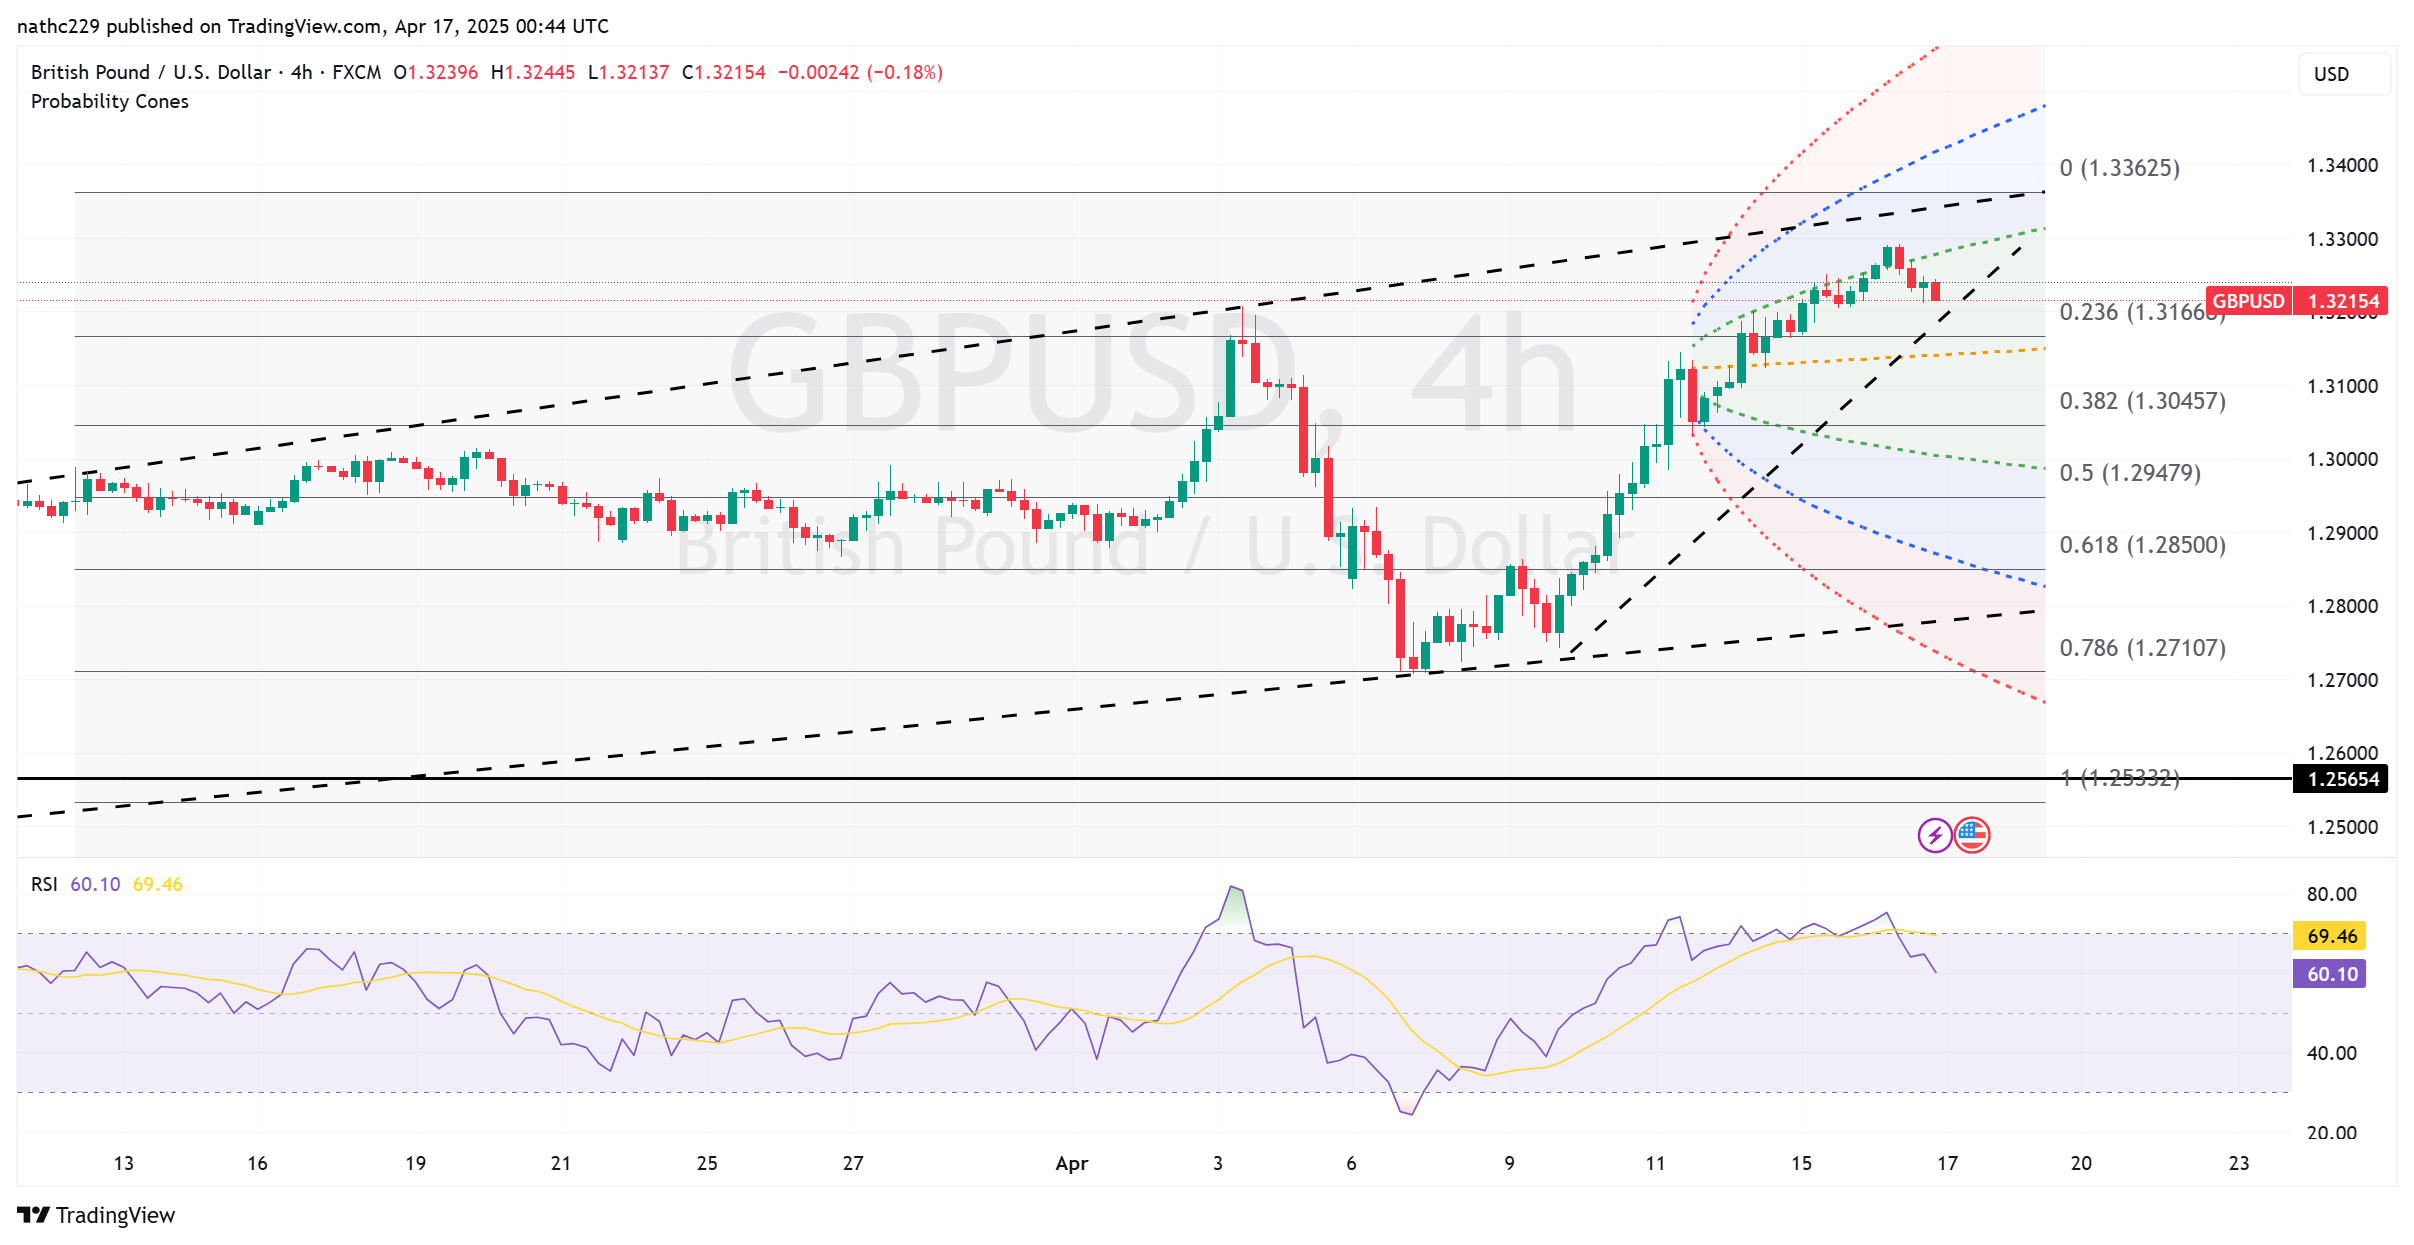
GBP/USD saw its bullish run encounter significant headwinds just below the critical resistance at 1.3300 during Wednesday’s session, with price action registering an intraday peak of 1.3292. Although the pair posted its seventh consecutive session of gains, this level represents a clear technical ceiling as bullish exhaustion sets in, confirmed by emerging negative RSI divergence on shorter-term charts. Such divergence typically precedes at least a short-term reversal, indicating increasing vulnerability to a corrective move lower in the near term.
Technically, the pair’s fall back below the 20-hour moving average around 1.3240 is a notable bearish development, opening the door for a potential retest of lower levels beneath the key psychological support at 1.3200. Immediate support is closely aligned with the prior year-to-date high at 1.3207; a decisive break below this could see bearish momentum gather pace, targeting deeper support at approximately 1.3150. Traders should closely monitor these critical support zones, as any sustained break would significantly alter the short-term bullish picture, potentially leading to more pronounced downside price action.
Fundamentally, UK CPI data underperforming expectations—with the services inflation print at 4.7% versus the anticipated 4.9%—reinforces the view that risks around the Bank of England's upcoming rate decision remain tilted to the dovish side. While market focus remains primarily fixed on the U.S. tariff situation, traders may become increasingly cautious toward GBP positions, potentially pivoting to alternative pairs like EUR/GBP, which currently shows technical strength, having found solid support around the 200-week moving average at 0.8545. Overall, GBP/USD bulls face increased near-term technical and fundamental headwinds, suggesting the pair may soon enter a corrective phase.