

Bitcoin Tests Key Support at $68,752 Amid Neutral Market Momentum
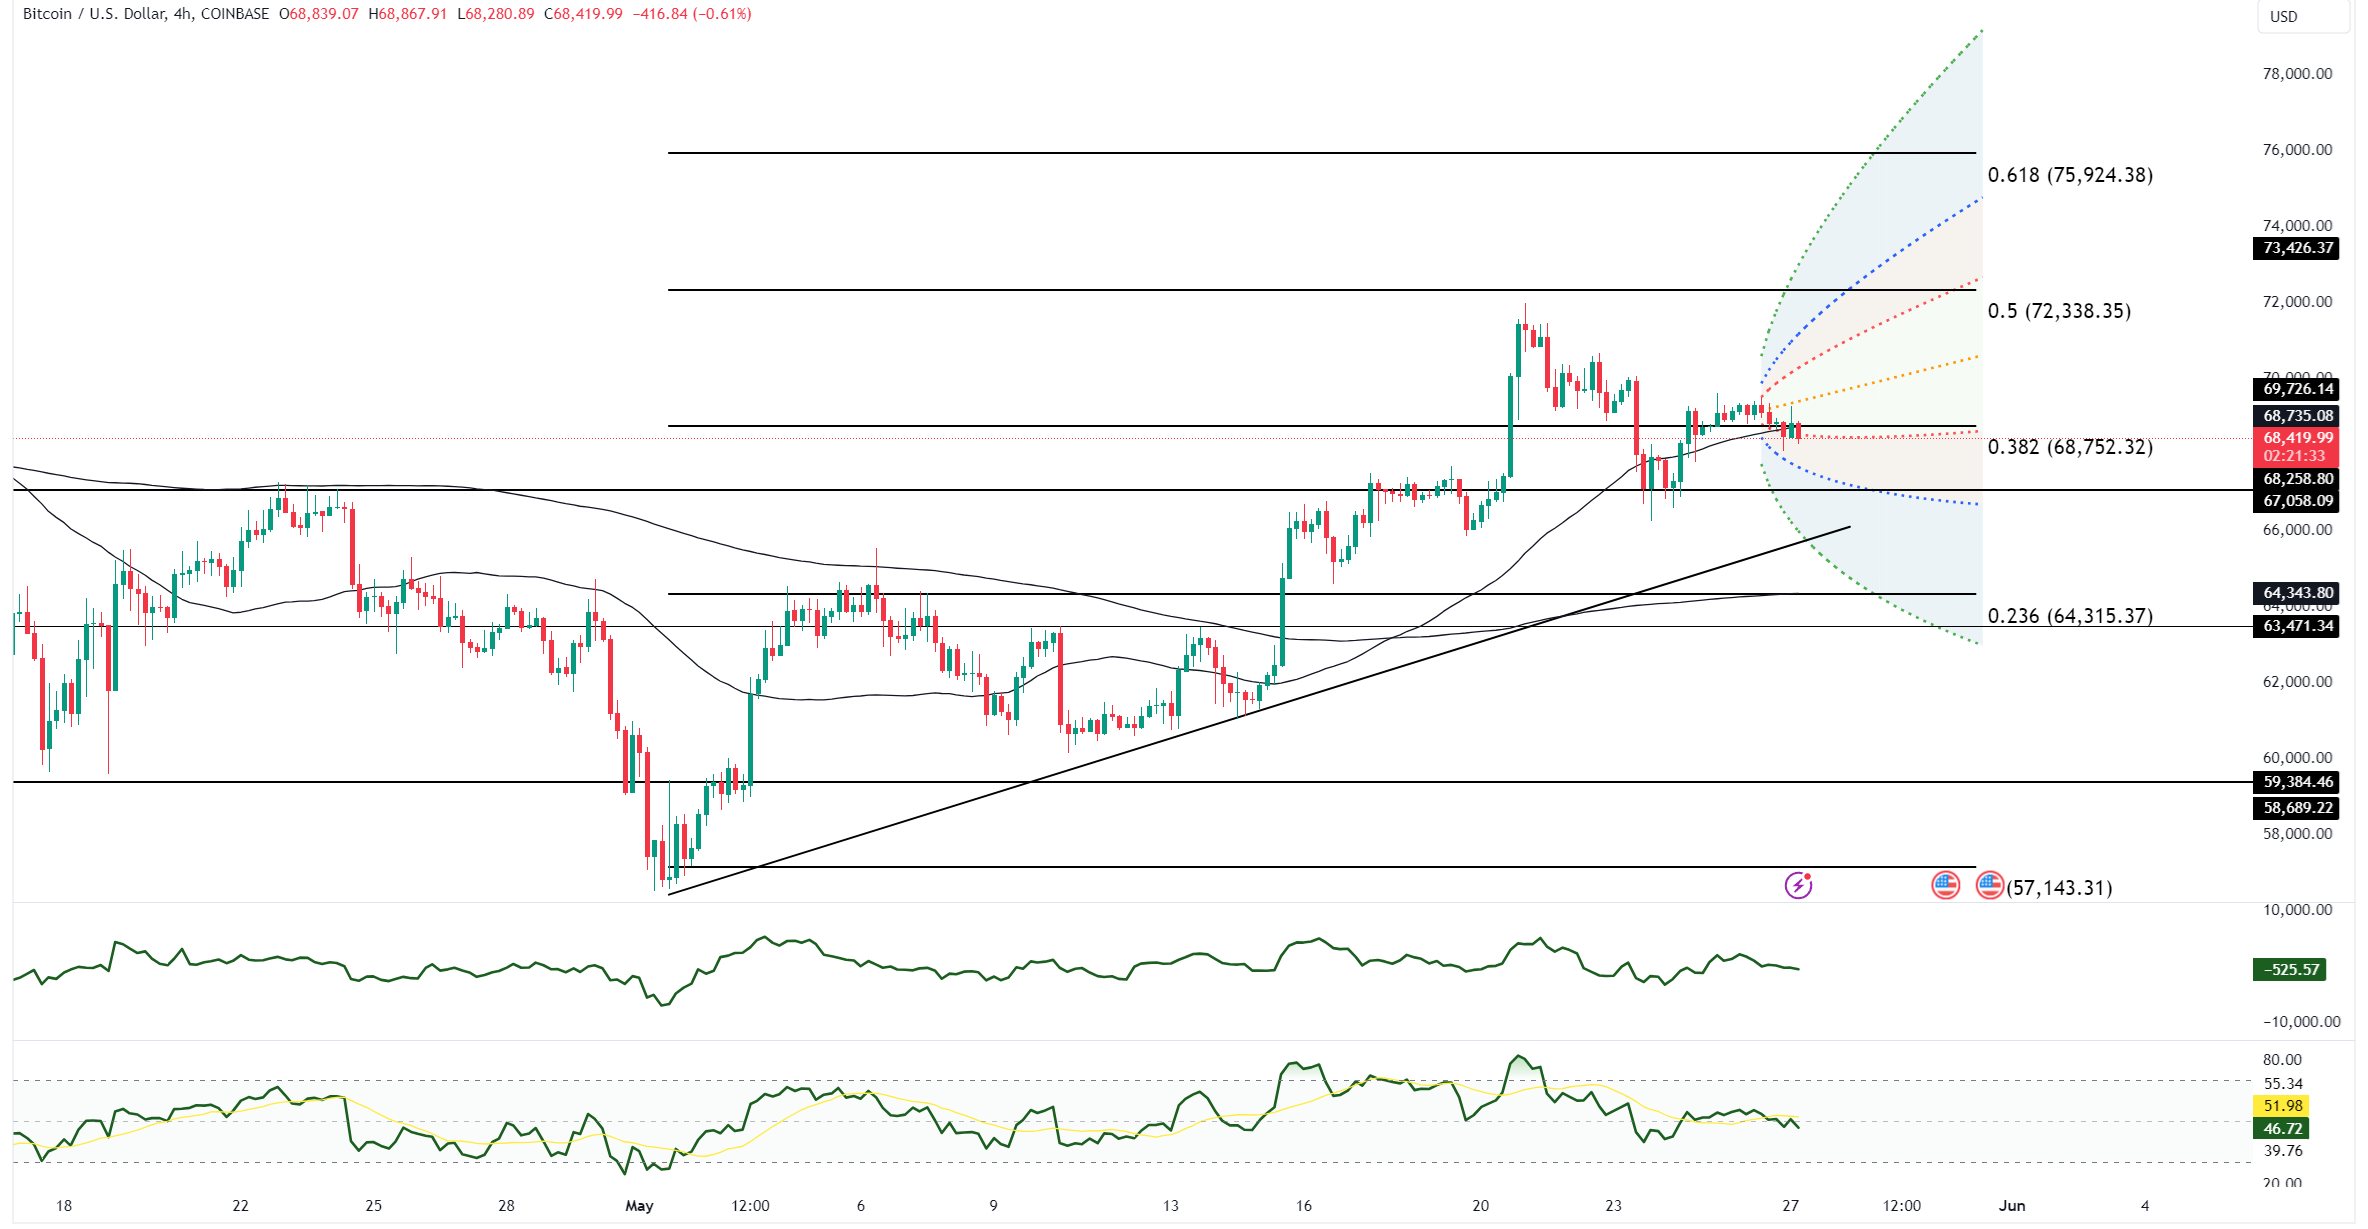
The chart of Bitcoin (BTC/USD) on the 4-hour timeframe showcases a comprehensive technical analysis with the use of various indicators and drawing tools. The price is currently hovering around $68,419, showing a slight decrease of 0.61%. The chart employs Fibonacci retracement levels from a recent low to a high, indicating potential support and resistance levels. The key levels include the 0.236 retracement at $64,315.37, the 0.382 retracement at $68,752.32, the 0.5 retracement at $72,338.35, and the 0.618 retracement at $75,924.38. The price appears to be testing the 0.382 retracement level, suggesting a potential area of support. Additionally, the chart displays several moving averages, which are likely the 50, 100, and 200-period moving averages, serving as dynamic support and resistance levels. The price's interaction with these averages indicates the prevailing trend's strength and potential reversal points.
Furthermore, the chart features two oscillators, the Momentum and the RSI. The RSI, with a current reading around 46.72, indicates that the market is neither overbought nor oversold, suggesting a neutral momentum. The MACD, shows a histogram that reflects the difference between the MACD line and the signal line, providing insights into the market's momentum and potential trend reversals. The confluence of these indicators around the Fibonacci retracement levels and moving averages provides a robust framework for anticipating price movements. Traders would likely look for a break above or below these key levels to make informed trading decisions.