

Using MACD Effectively for Currency Market Trading Strategy Development

Introduction
Traders and investors often rely on various technical indicators to make informed decisions in this fast-paced market. One such popular and versatile tool is the Moving Average Convergence Divergence (MACD) indicator. In this article, we will explore how to use MACD effectively for currency market trading strategy development.
Understanding MACD
The MACD indicator is a momentum oscillator that helps traders identify potential trend reversals, momentum shifts, and trade entry/exit points. It consists of two main components:
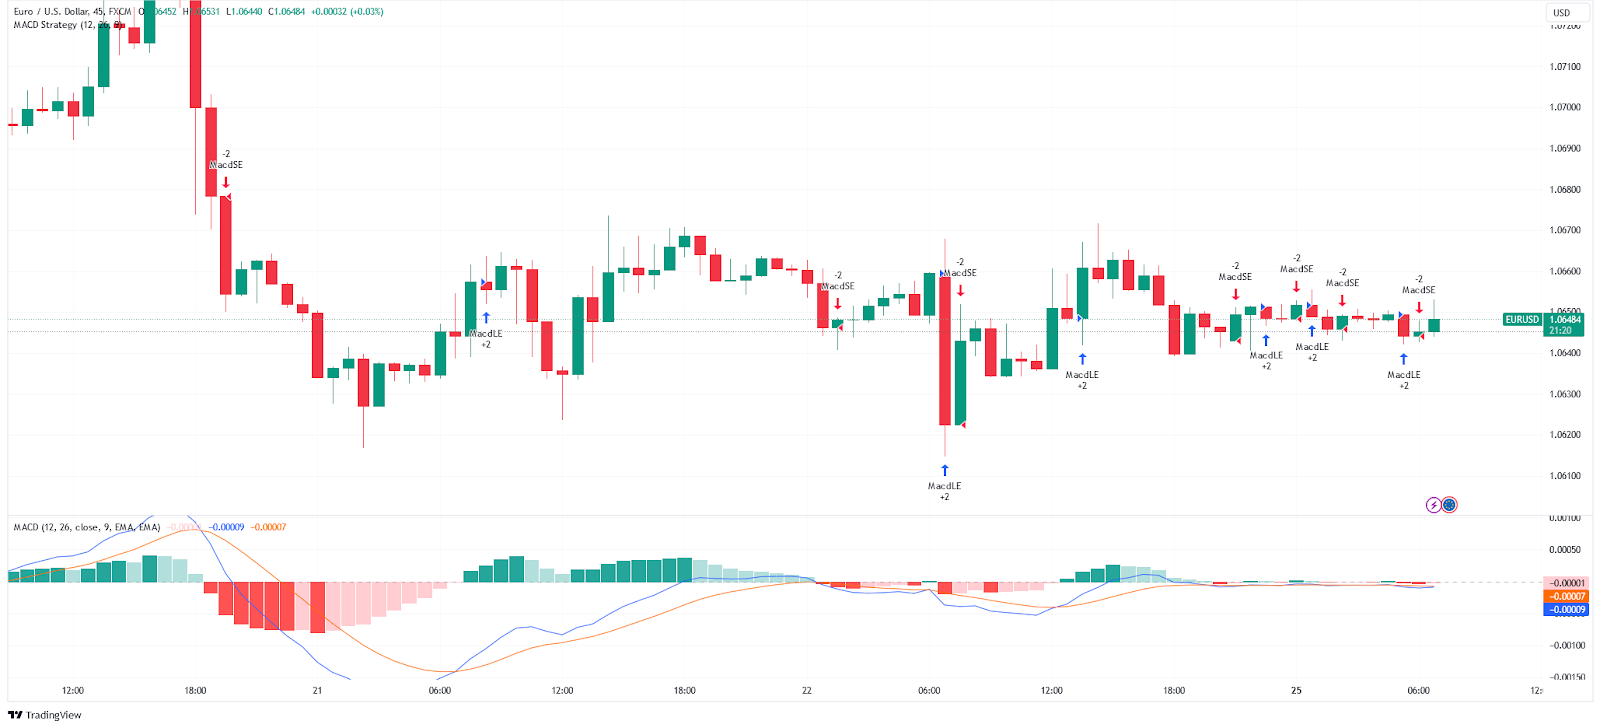
- MACD Line (Fast Line): This is the difference between the 12-period Exponential Moving Average (EMA) and the 26-period EMA. The result is a single line that oscillates above and below a zero line, indicating the short-term momentum of an asset.
- Signal Line (Slow Line): The Signal Line is typically a 9-period EMA of the MACD Line. It smoothens the MACD Line’s movements, making it easier to identify potential trade signals.
- Histogram: The MACD Histogram is created by subtracting the Signal Line from the MACD Line. It helps traders visualize the difference between the two lines and the strength of the momentum.
Using MACD for Currency Market Trading
Here are some effective ways to use the MACD indicator for developing trading strategies in the currency market:
- Identifying Trend Reversals:
- When the MACD Line crosses above the Signal Line, it generates a bullish signal, indicating a potential trend reversal to the upside. This is a buy signal.
- Conversely, when the MACD Line crosses below the Signal Line, it generates a bearish signal, indicating a potential trend reversal to the downside. This is a sell signal.
- Momentum Confirmation:
- Traders can use the MACD Histogram to confirm the strength of a trend. A rising histogram indicates increasing bullish momentum, while a falling histogram suggests increasing bearish momentum.
- Divergences between price and MACD Histogram can also be significant. For example, if the price is making higher highs, but the MACD Histogram is making lower highs, it may signal a weakening trend.
- Overbought and Oversold Conditions:
- The MACD indicator can also be used to identify overbought and oversold conditions. When the MACD Line moves far above the zero line, it suggests that the asset may be overbought, and a reversal could be imminent. Conversely, when it moves far below the zero line, it suggests oversold conditions and a potential reversal to the upside.
- Multiple Time Frame Analysis:
- Combining MACD analysis on multiple time frames can provide a more comprehensive view of the market. Traders often use higher time frame MACD crossovers for trend direction and lower time frames for precise entry and exit points.
- Risk Management:
- Always use risk management techniques like stop-loss orders and proper position sizing to protect your capital when trading with MACD signals.

Conclusion
The MACD indicator is a powerful tool for currency market traders when used effectively. It can help identify potential trend reversals, confirm momentum, and spot overbought or oversold conditions. However, like all technical indicators, it is not foolproof and should be used in conjunction with other analysis methods and risk management strategies.
Successful trading in the currency market requires a deep understanding of market dynamics, discipline, and continuous learning. Traders should also consider backtesting their MACD-based strategies on historical data to assess their effectiveness before applying them in real-time trading.