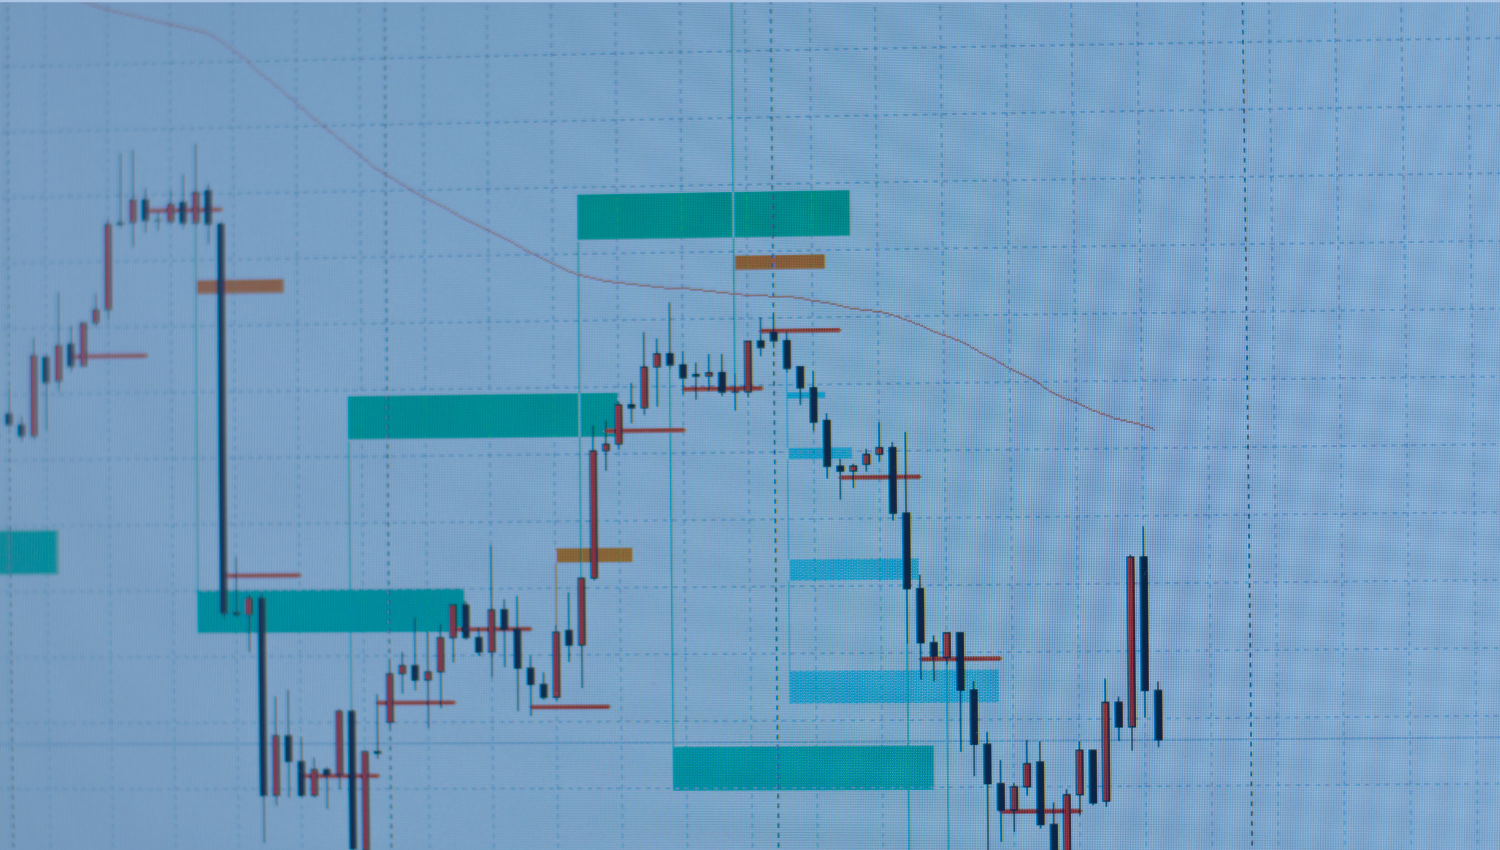
Understanding and Spotting Breakout Trades in the Stock Market

Introduction:
Breakout trades are a popular strategy among traders in the stock market. A breakout occurs when the price of a stock moves beyond a specific level of support or resistance, indicating a potential shift in market sentiment. Identifying and capitalizing on these breakout trades can lead to significant profits. In this article, we will explore the concept of breakout trades and provide insights on how to spot them effectively.
What are Breakout Trades?
A breakout trade happens when the price of a stock breaks through a key level of support or resistance. Support refers to a price level where the stock has consistently found buyers, preventing the price from falling further. Resistance, on the other hand, is a price level where the stock has repeatedly faced selling pressure, preventing the price from rising higher. When the price breaks through these levels with increased volume, it signifies a potential change in market sentiment and the beginning of a new trend.
Identifying Key Levels of Support and Resistance:
To spot breakout trades, traders need to identify key levels of support and resistance. These levels can be determined using various technical analysis tools, such as:
- Trendlines: Drawing trendlines connecting significant price points can help identify potential breakout levels.
- Moving Averages: When the price crosses above or below a significant moving average, such as the 50-day or 200-day moving average, it may indicate a breakout.
- Fibonacci Retracements: These levels, derived from Fibonacci ratios, can act as potential support or resistance levels and serve as breakout points.
- Chart Patterns: Recognizable chart patterns, such as head and shoulders, triangles, or wedges, can provide clues about potential breakouts.
Confirming Breakouts with Volume:
A genuine breakout is often accompanied by a significant increase in trading volume. When the price breaks through a key level with high volume, it suggests strong market participation and increases the likelihood of a sustained move in the breakout direction. Traders should look for volume spikes that exceed the average daily volume to confirm the validity of a breakout.
Managing Risk in Breakout Trades:
While breakout trades can offer substantial rewards, they also carry inherent risks. False breakouts, where the price briefly breaks through a level but quickly reverses, can lead to losses. To manage risk, traders should:
- Set Stop-Losses: Place stop-loss orders below the breakout level to limit potential losses if the breakout fails.
- Use Proper Position Sizing: Allocate an appropriate portion of the trading account to each breakout trade based on the account size and risk tolerance.
- Confirm with Other Indicators: Validate breakouts using other technical indicators, such as relative strength index (RSI) or moving average convergence divergence (MACD), to increase the probability of success.
Conclusion:
Breakout trades offer traders the opportunity to capitalize on significant price movements in the stock market. By understanding the concept of support and resistance, identifying key levels, confirming breakouts with volume, and managing risk appropriately, traders can improve their chances of success. However, it is crucial to remember that no trading strategy is foolproof, and thorough analysis and risk management should always be prioritized. With practice and discipline, spotting and executing breakout trades can be a valuable addition to a trader's arsenal.
Open an account today to unlock the benefits of trading with CMS Financial

