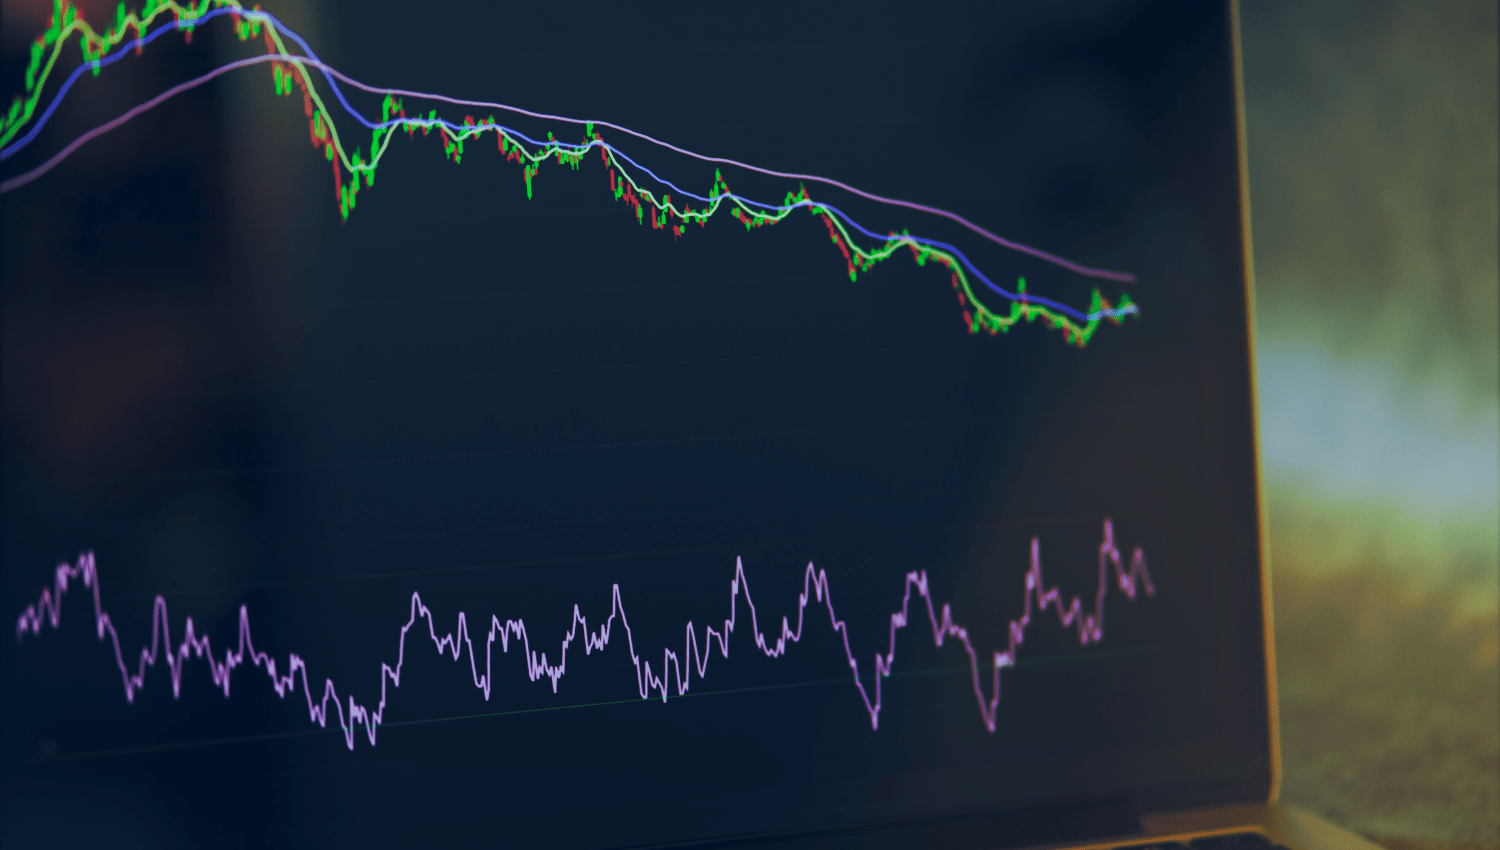
Pros and Cons of Using RSI, MACD, and Stochastic Oscillator for Detecting Market Reversals

Technical indicators like the Relative Strength Index (RSI), Moving Average Convergence Divergence (MACD), and Stochastic Oscillator are essential tools in a trader's arsenal. Each of these indicators offers unique insights into market momentum, trend strength, and potential reversal points, aiding traders in making informed decisions. However, understanding their individual strengths and limitations is crucial for their effective application in real market scenarios.
Relative Strength Index (RSI)
Pros:
- Simplicity and Clarity: RSI is straightforward to calculate and interpret, making it accessible even to novice traders. Its clear thresholds (30 for oversold and 70 for overbought) provide unambiguous signals for potential reversals.
- Versatility: RSI can be applied to various markets and timeframes, from stocks and forex to commodities and cryptocurrencies, making it a versatile tool in a trader's arsenal.
- Momentum Insights: RSI effectively measures momentum, helping traders identify the strength of a trend and potential exhaustion points where reversals might occur.
Cons:
- False Signals: In strong trending markets, RSI can produce false reversal signals, indicating overbought or oversold conditions prematurely and leading to potentially unprofitable trades.
- Lagging Nature: As a momentum oscillator, RSI can lag, especially during rapid market movements, causing delays in recognizing actual trend reversals.
- Limited Context: RSI doesn’t account for broader market context or fundamental factors, which can result in misleading signals if used in isolation.
Moving Average Convergence Divergence (MACD)
Pros:
- Trend Confirmation: MACD is excellent for confirming trends and identifying potential trend reversals, combining momentum and trend-following elements.
- Divergence Signals: Divergence between MACD and price action can signal potential reversals, providing early warning signs of trend changes.
- Flexibility: MACD can be tailored to different trading styles by adjusting the periods of the moving averages, making it suitable for both short-term and long-term trading strategies.
Cons:
- Lagging Indicator: MACD, being based on moving averages, inherently lags behind price action, which can result in delayed signals and missed opportunities in fast-moving markets.
- Complex Interpretation: Interpreting MACD signals, such as crossovers and divergences, can be complex and may require experience to use effectively.
- Whipsaws in Sideways Markets: In ranging or choppy markets, MACD can produce frequent false signals, leading to potential losses from whipsaw trades.
Stochastic Oscillator
Pros:
- Overbought/Oversold Clarity: The Stochastic Oscillator provides clear indications of overbought and oversold conditions, helping traders identify potential reversal points.
- Early Signals: This oscillator often provides early reversal signals compared to other indicators, allowing traders to enter or exit trades sooner.
- Complementary Tool: It works well in conjunction with other indicators, such as moving averages or trendlines, to confirm potential signals and reduce false positives.
Cons:
- False Signals in Strong Trends: In strongly trending markets, the Stochastic Oscillator can give false reversal signals, indicating overbought or oversold conditions too early.
- Whipsaws in Volatile Markets: Like other oscillators, it can produce whipsaws in volatile or ranging markets, leading to potential losses from frequent false signals.
- Complexity in Interpretation: Understanding the nuances of %K and %D crossovers and how they relate to market conditions can be challenging for beginners, requiring experience and practice to use effectively.
Effective Use in Real Market Scenarios
To maximize the benefits of RSI, MACD, and Stochastic Oscillator in trading, consider the following strategies:
Combine Indicators for Confirmation:
- Use RSI to identify overbought and oversold conditions, then confirm potential reversals with MACD crossovers or Stochastic signals.
- Example: If RSI shows oversold conditions (below 30) and MACD shows a bullish crossover, it strengthens the reversal signal.
Adjust Timeframes for Context:
- Align the timeframes of your indicators with your trading strategy. For short-term trades, use shorter periods for RSI and MACD; for long-term investments, use longer periods.
- Example: Day traders might use a 5-day RSI, while long-term investors might prefer a 14-day RSI.
Divergence as a Signal:
- Look for divergences between the price action and the indicators (MACD and Stochastic) to spot early reversal signals.
- Example: If the price is making higher highs but MACD is making lower highs, it indicates a potential bearish reversal.
Combine with Trend Analysis:
- Use these indicators in conjunction with trend lines or moving averages to filter out false signals and improve accuracy.
- Example: If the Stochastic Oscillator indicates overbought conditions, but the price is above a rising moving average, consider waiting for further confirmation before taking action.
Adapt to Market Conditions:
- Adjust your use of indicators based on market conditions. In trending markets, focus more on MACD for trend confirmation; in ranging markets, rely on RSI and Stochastic for identifying reversal points.
- Example: In a sideways market, prioritize RSI and Stochastic for entry and exit points, while in a trending market, use MACD to stay with the trend longer.
By combining these indicators and adapting them to different market conditions, traders can enhance their decision-making process, reduce false signals, and improve their overall trading performance.
Conclusion
While the RSI, MACD, and Stochastic Oscillator are powerful tools for identifying potential market reversals, each comes with its own set of advantages and limitations. Understanding these pros and cons is essential for traders to effectively incorporate these indicators into their strategies. By combining these indicators with other technical analysis tools and considering broader market contexts, traders can improve their decision-making processes and enhance their chances of trading success.
Open an account today to unlock the benefits of trading with CMS Financial

