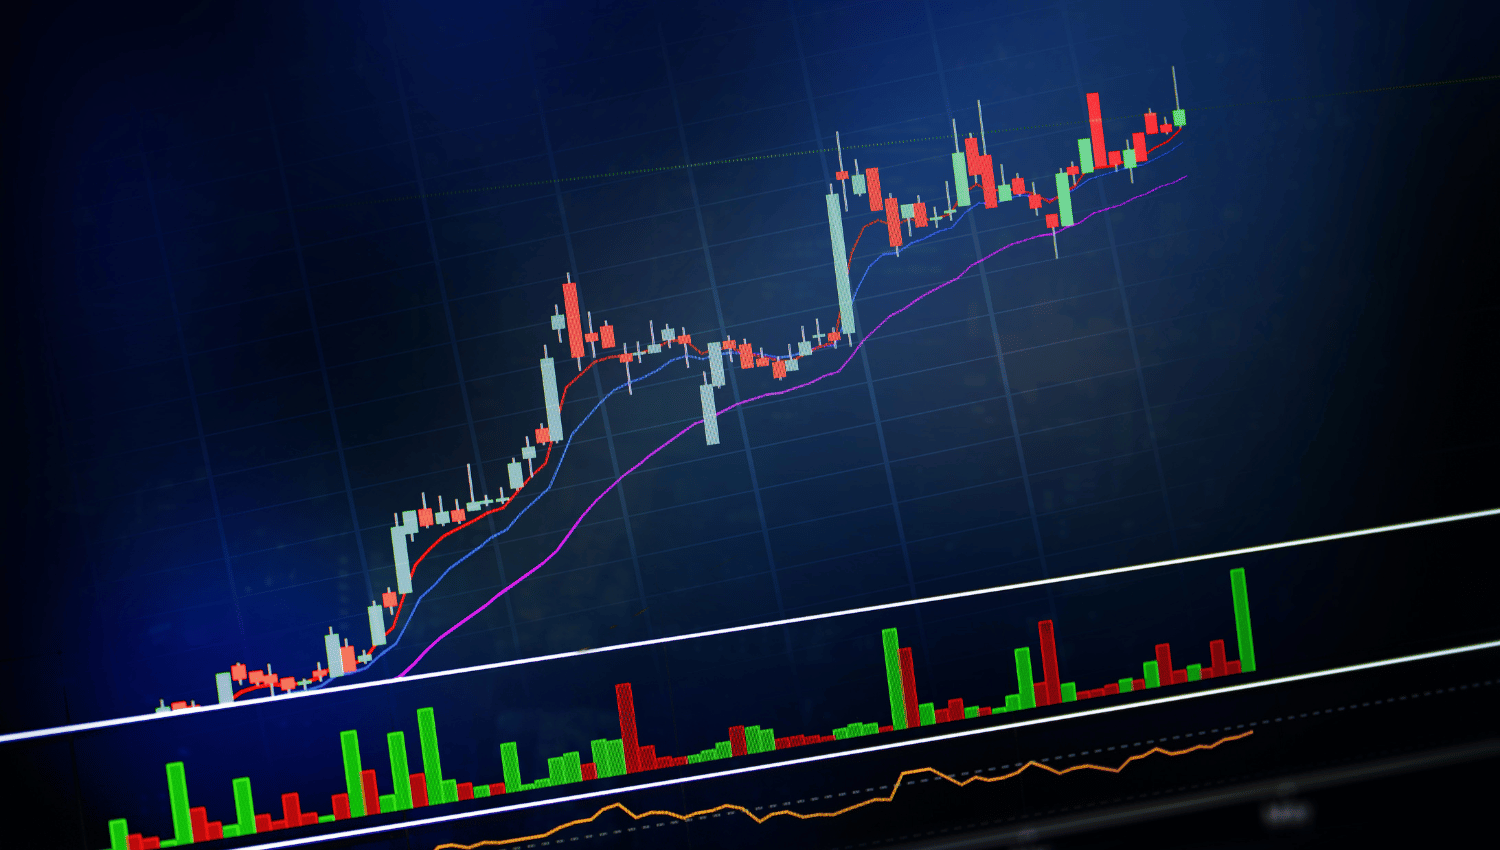
Mastering Volume Analysis: Techniques for Generating Effective Trade Ideas

Volume analysis is an essential aspect of technical trading, providing insights into the strength and direction of market movements. By examining trading volume, traders can validate price trends, anticipate reversals, and generate effective trade ideas. This article explores various volume analysis methods to help traders make informed decisions.
Understanding Volume in Trading
Volume refers to the number of shares or contracts traded in a security or market during a given period. High volume typically indicates strong interest and activity, while low volume suggests a lack of interest. By analyzing volume, traders can gain insights into market sentiment and the sustainability of price movements.
Key Volume Analysis Methods
Volume Price Trend (VPT) Indicator
The VPT indicator combines price and volume to determine the direction of a trend. It accumulates volume based on the proportionate change in price, helping traders identify bullish or bearish trends.
How to use VPT:
- A rising VPT suggests a bullish trend, indicating that buying pressure is strong.
- A falling VPT indicates a bearish trend, showing that selling pressure is dominant.
- Divergence between VPT and price may signal a potential reversal.
On-Balance Volume (OBV)
OBV measures cumulative buying and selling pressure by adding volume on up days and subtracting volume on down days. It helps traders confirm price trends and predict reversals.
How to use OBV:
- A rising OBV line suggests that volume is supporting the upward price movement.
- A falling OBV line indicates that volume is accompanying a downward price movement.
- Divergence between OBV and price can indicate a potential reversal.
Volume Moving Average (VMA)
The VMA smooths out volume data to identify average volume levels over a specific period. It helps traders spot unusual volume spikes or drops, which may signal significant market events.
How to use VMA:
- Compare current volume with the VMA to identify abnormal activity.
- Volume spikes above the VMA can indicate strong buying or selling interest.
- Volume below the VMA suggests a lack of interest, potentially signaling a weak trend.
Volume Oscillator
The Volume Oscillator measures the difference between two volume moving averages, highlighting changes in volume trends.
How to use Volume Oscillator:
- Positive values indicate increasing volume, suggesting stronger market moves.
- Negative values show decreasing volume, implying weaker market trends.
- Crossovers between the short-term and long-term VMA lines can signal potential entry or exit points.
Accumulation/Distribution Line (A/D Line)
The A/D Line uses both price and volume to assess whether a stock is being accumulated (bought) or distributed (sold). It helps traders understand the underlying buying or selling pressure.
How to use A/D Line:
- A rising A/D Line indicates accumulation, suggesting that buyers are in control.
- A falling A/D Line signals distribution, indicating that sellers are dominating.
- Divergence between the A/D Line and price can hint at potential trend reversals.
Practical Application of Volume Analysis
Confirming Trends
Volume analysis can confirm the strength of a trend. For example, if a stock is in an uptrend with increasing volume, it indicates strong buying interest and the likelihood of the trend continuing.
Identifying Reversals
Volume can signal potential reversals. For instance, if a stock price is rising but volume is decreasing, it may indicate weakening buying interest and a possible reversal.
Spotting Breakouts and Fakeouts
Breakouts accompanied by high volume are more likely to be genuine, while low-volume breakouts may be false signals. Traders can use volume analysis to differentiate between real and fake breakouts.
Generating Trade Ideas
- Look for volume spikes: Unusual volume activity can indicate significant market events, providing trade opportunities.
- Use divergence signals: Divergences between volume indicators and price can highlight potential entry or exit points.
- Combine volume with other indicators: Integrate volume analysis with technical indicators like moving averages, RSI, or MACD for comprehensive trade strategies.
Conclusion
Volume analysis is a powerful tool for traders seeking to generate effective trade ideas. By understanding and applying various volume analysis methods, traders can validate trends, anticipate reversals, and make more informed trading decisions. Incorporating volume analysis into your trading strategy can enhance your ability to navigate the markets and improve your trading outcomes.

