Effectively Leveraging Ichimoku Clouds for Trading Strategies

The Ichimoku Cloud, also known as Ichimoku Kinko Hyo, is a comprehensive indicator that offers insights into support and resistance levels, momentum, and trend direction. This guide delves into the ways traders can employ the Ichimoku Cloud to refine their trading strategies, make informed decisions, and potentially enhance their trading outcomes.
Understanding the Ichimoku Cloud
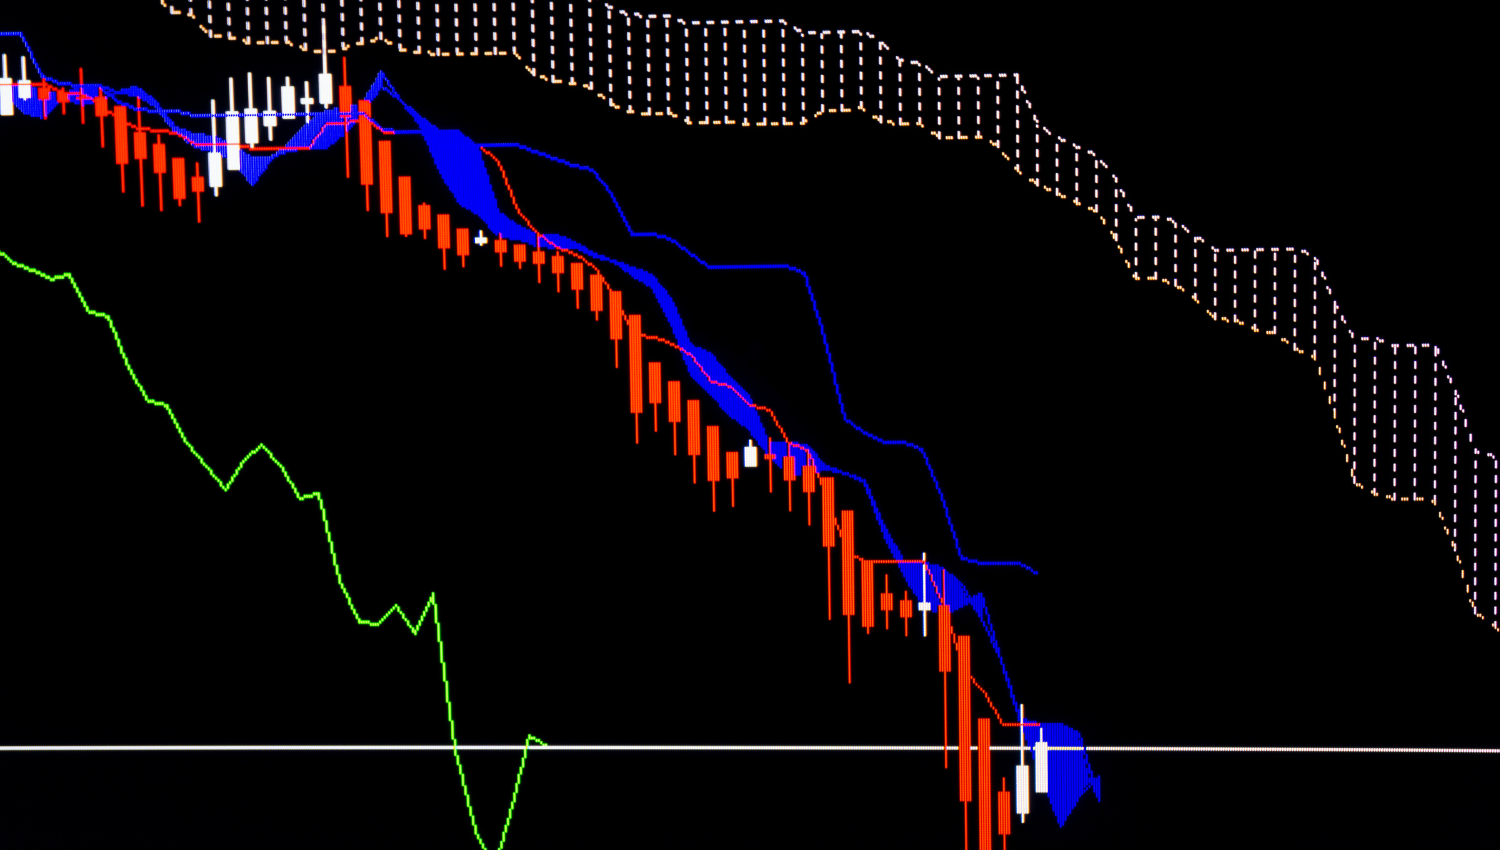
The Ichimoku Cloud is composed of five primary elements:
- Tenkan-sen (Conversion Line): Calculated as the average of the highest high and the lowest low over the last 9 periods, it serves as a shorter-term gauge of potential price movements.
- Kijun-sen (Base Line): This average of the highest high and the lowest low over the last 26 periods often acts as a catalyst for potential trading signals.
- Senkou Span A (Leading Span A): Calculated as the average of the Tenkan-sen and Kijun-sen and plotted 26 periods ahead, this helps form the faster boundary of the Cloud.
- Senkou Span B (Leading Span B): This represents the average of the highest high and the lowest low over the past 52 periods, also plotted 26 periods ahead, forming the slower boundary of the Cloud.
- Chikou Span (Lagging Span): This is the closing price plotted 26 periods in the past, providing a clear comparison of current to past prices.
How to Utilize Ichimoku Clouds in Trading
Identifying Trends
The position of the price in relation to the Cloud can indicate the prevailing trend. A price above the Cloud suggests an uptrend, below it indicates a downtrend, and movement within the Cloud suggests consolidation or a potential trend change.
Trading Signals
Ichimoku Clouds can generate various trading signals:
- Price Crosses: A fundamental signal is when the price crosses the Cloud. Moving from below to above the Cloud suggests a potential buy signal, while moving from above to below indicates a sell signal.
- Tenkan-sen and Kijun-sen Crosses: Known as the "TK Cross," this occurs when the Tenkan-sen crosses over the Kijun-sen. A bullish signal is issued when the Tenkan-sen crosses above the Kijun-sen, particularly if this happens above the Cloud. A bearish signal is when it crosses below, especially below the Cloud.
- Chikou Span Confirmation: The Chikou Span should confirm the sentiment indicated by other signals. For a bullish signal, the Chikou Span should be above the price line from 26 periods ago; for a bearish signal, below it.
Momentum and Support/Resistance Levels
The Cloud itself is a visual representation of support or resistance. In an uptrend, the Cloud forms support zones that may indicate where buying pressure could resume. In a downtrend, it indicates resistance areas where selling pressure may intensify.
Tips for Maximizing Ichimoku Cloud Efficacy
- Wait for Confirmation: Due to the comprehensive nature of Ichimoku, it is advisable to wait for multiple components to confirm a signal before trading.
- Combine with Other Indicators: While powerful, using the Ichimoku Cloud in conjunction with other indicators like RSI or MACD can provide further confirmation and enhance decision-making.
- Adjust Settings Based on Time Frame: Ichimoku settings can be modified depending on the trading time frame and strategy. For example, day traders might opt for shorter periods, while long-term traders might stick with standard settings.
Conclusion
The Ichimoku Cloud is a dynamic tool that provides a holistic view of potential market movements. By understanding and effectively utilizing its components, traders can spot trends, capture momentum, and identify high-probability trades. However, mastering the Ichimoku Cloud, like any trading tool, requires practice and patience and should be part of a comprehensive trading strategy that includes sound risk management techniques.

